


Getting a CGM is one thing. Actually knowing what to do with all the numbers, arrows, and graphs it produces is something else entirely. If you've found yourself staring at your CGM app and feeling more confused than informed, you're not alone. The data is genuinely powerful, but only once you understand what you're looking at. This guide walks through the four main things your CGM shows you, what each one means in plain language, and how to use them together to make smarter day-to-day decisions.
The 4 Key Metrics Your CGM Tracks
Every CGM app and report is built around the same core set of measurements. According to a clinical consensus statement published in PubMed Central by the International Diabetes Center, these are the standard metrics used to interpret CGM data in both clinical and everyday settings:
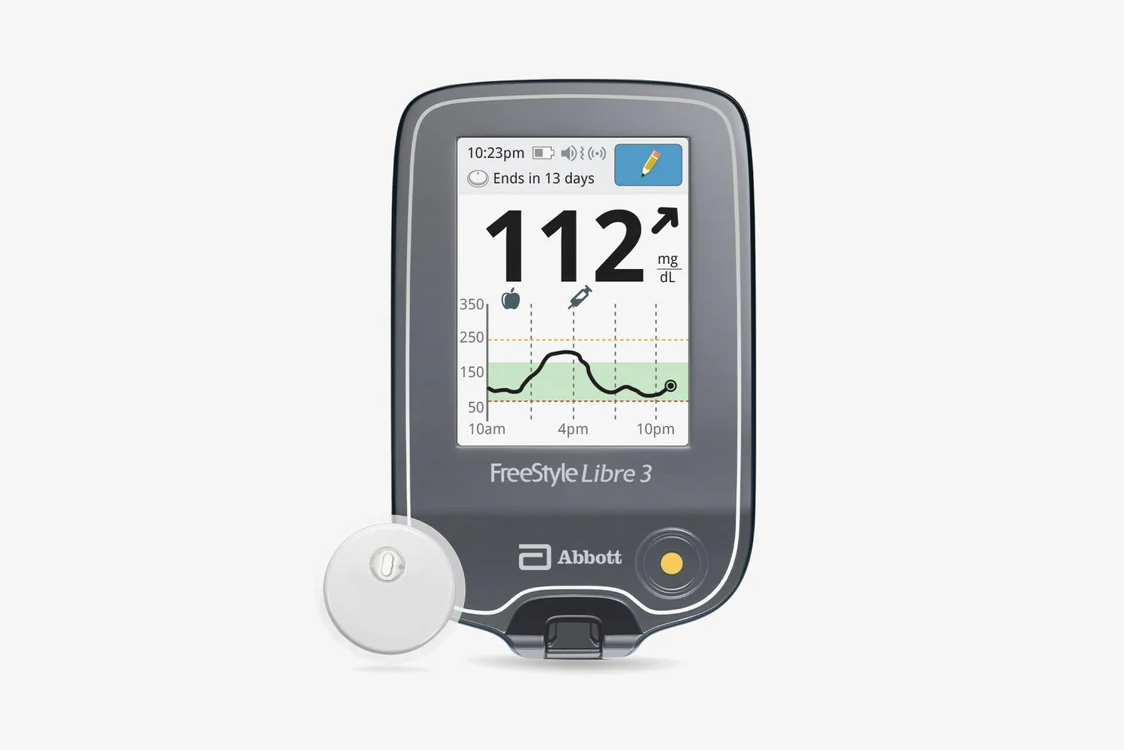
- Current glucose reading: Your glucose level right now, updated every 1 to 5 minutes depending on the device
- Trend arrows: An indicator of where your glucose is headed and how fast, based on the past 15 minutes of readings
- Time in Range (TIR): The percentage of time your glucose stays within your target range (typically 70 to 180 mg/dL for most people)
- Ambulatory Glucose Profile (AGP): A standardized visual report that compresses multiple days of CGM data into a single 24-hour chart, showing patterns and trends at a glance
Most of your moment-to-moment decisions will be guided by your current reading and trend arrows. TIR and the AGP are the tools that help you and your care team see the bigger picture over days and weeks.
Understanding Trend Arrows: Your CGM's Most Actionable Feature
Your current glucose number tells you where you are. The trend arrow tells you where you're going, and that distinction matters enormously for making good decisions in real time.
A study published in PubMed Central found that trend arrows indicate the likely direction and rate of glucose change over the next 30 to 60 minutes, based on the rate of change across recent sensor readings. A single upward arrow means glucose is rising moderately. Two upward arrows means it's rising fast. A horizontal arrow means glucose is stable. Downward arrows work the same way in reverse.
Here's why this matters practically: imagine your CGM reads 130 mg/dL. Without a trend arrow, that seems like a comfortable, in-range reading. With a double upward arrow, that same 130 tells a different story. Your glucose is rising quickly and may reach 200 mg/dL or higher within the next hour. The number alone didn't tell you that.
Common situations where trend arrows change how you should respond:
- Before a meal: A downward arrow at 90 mg/dL may mean you want to eat soon or adjust your bolus timing
- After exercise: A falling arrow after a workout can signal an incoming low worth treating proactively
- Before bed: A rising arrow at a borderline reading may warrant a small correction before sleep
- During a suspected low: A rapidly falling arrow confirms urgency even if the number isn't yet in the low range
The specific arrow definitions vary slightly by device manufacturer, so it's worth reviewing the guide for your specific CGM. If you're using a Dexcom G7 or FreeStyle Libre 3 Plus, each manufacturer publishes guidance on how to interpret and act on trend arrows as part of their device education materials. Always work with your diabetes care team when making insulin dose adjustments based on trend data.
Time in Range and the Ambulatory Glucose Profile: Your Long-View Tools
While trend arrows help you respond to what's happening right now, Time in Range (TIR) and the Ambulatory Glucose Profile (AGP) help you understand how your management is going over time. These are the metrics most likely to come up in conversations with your care team.
Time in Range measures the percentage of the day your glucose stays within your target range. For most people, that target is 70 to 180 mg/dL, and the general goal recommended by the American Diabetes Association is spending at least 70% of the day in range, roughly 17 out of 24 hours. Your provider may set a different target based on your specific situation, age, and management goals.
TIR gives you information that A1C alone can't. A1C measures your average glucose over three months, but an average can look acceptable even if you're experiencing frequent highs and lows that cancel each other out. TIR breaks that down further, showing how much time you're spending high, in range, and low separately. Research published in PubMed Central confirms that 14 consecutive days of CGM wear is generally sufficient to generate a reliable TIR report, as long as the sensor was active for at least 70% of that period.
The Ambulatory Glucose Profile (AGP) is a standardized one-page report endorsed by the ADA and the International Diabetes Center that combines multiple days of CGM data into a single 24-hour visual. According to a clinical review published in PubMed Central, the AGP shows your median glucose line, the middle 50% of your readings (interquartile range), and the outer 80% of readings, all layered over a single day timeline. This makes it easy to see patterns that would be invisible looking at individual daily graphs: whether your glucose is consistently rising overnight, spiking after a specific meal window, or dropping predictably mid-afternoon.
Most CGM apps generate an AGP-style report automatically. For the Dexcom G7, this report is available through the Dexcom Clarity app. For Abbott FreeStyle Libre sensors, it's available through LibreView. Bringing a printed or shared copy to your provider appointments gives your care team immediate insight into your glucose patterns without having to review days of individual logs.
Why Learning to Read Your Data Makes a Real Difference
A CGM generates hundreds of glucose readings per day. That data is only valuable if you know what to do with it. Understanding trend arrows turns a passive monitor into an active management tool. Understanding TIR gives you a meaningful, daily feedback loop that goes beyond what a quarterly A1C can offer. And understanding your AGP gives you and your provider the clearest possible picture of where your management is working well and where adjustments might help. At Adapt Health Diabetes, we want your devices to work for you. Explore our Education page and Learning Center for more practical guides on using your diabetes technology effectively.
Frequently Asked Questions About Reading CGM Data
What should I do when my CGM reads low but I feel fine?
Check your trend arrow first. If glucose is reading low but stable or slightly rising, the sensor may be catching the tail end of a dip that's already recovering. If the arrow is still falling, treat the low as you normally would, even without symptoms. Some people experience hypoglycemia unawareness, meaning they don't feel symptoms until glucose is already quite low. When in doubt, confirming with a fingerstick is a reasonable step before deciding whether to treat.
How often should I check my Time in Range?
Many diabetes educators suggest reviewing your TIR report roughly every two weeks to spot patterns without getting too caught up in day-to-day fluctuations. Your care team will typically review TIR at each appointment alongside or instead of relying solely on A1C. Checking too frequently can make normal daily variability seem more alarming than it is. A two-week window gives you enough data to see meaningful trends.
Do trend arrows account for the CGM's natural lag in readings?
Yes. Trend arrows are calculated from recent changes in interstitial glucose, so they already reflect what the sensor has been measuring over the past 15 minutes. The lag between interstitial and blood glucose (up to 15 minutes during rapid changes) is the same lag that affects the trend arrow calculation. This is why trend arrows are considered a forward-looking indicator: they project where glucose is likely to be in the next 30 to 60 minutes based on recent direction and speed, not just the current reading.
What does a wide band on my AGP report mean?
A wide band on the AGP indicates high glucose variability, meaning your readings at a given time of day are spread across a large range rather than clustering tightly. Wide bands are common around mealtimes and often point to areas where timing, carbohydrate estimation, or bolus strategy could be refined. A narrow band generally indicates consistent, predictable glucose behavior. Your care team can help you interpret specific areas of variability and suggest adjustments.
My CGM app shows a GMI. Is that the same as A1C?
Close, but not exactly. GMI (Glucose Management Indicator) is an estimate of what your A1C might be based on your average CGM glucose over the past two to four weeks. It's useful as a between-appointment reference, but laboratory A1C tests measure something slightly different and remain the clinical standard for long-term glucose management. Your GMI and lab A1C may differ by a meaningful amount, which is normal and doesn't mean either one is wrong.
Get the Right CGM and the Support to Use It Well
Understanding your data starts with having a reliable device and the right supplies delivered on time. Adapt Health Diabetes carries sensors, readers, and transmitters for Dexcom and Abbott FreeStyle systems, verified through your insurance and shipped directly to your door. Visit our Resources page to learn more, or contact our team with questions about getting started.
This article is for educational purposes only and does not replace professional medical advice. Always consult your healthcare provider or diabetes care team regarding interpretation of your CGM data and any adjustments to your diabetes management plan.
Sources
- Battelino T, et al. Clinical Targets for Continuous Glucose Monitoring Data Interpretation: Recommendations From the International Consensus on Time in Range. PubMed Central. 2019.
- Dover AR, et al. Utilizing the New Glucometrics: A Practical Guide to Ambulatory Glucose Profile Interpretation. PubMed Central. 2022.
- Cobelli C, et al. Use of Continuous Glucose Monitoring Trend Arrows in the Younger Population with Type 1 Diabetes. PubMed Central. 2021.
- American Diabetes Association. CGM and Time in Range. ADA.


